How Does a Smartphone Camera Capture Good Enough Images
May 3, 2024

When an image is not just an image
The technology applies a unique mix of signal processing and AI technologies, combined with a proprietary mathematical back-end to analyse a signal taken from exposed exposed card. First we apply motion compensation and illumination normalisation and supports any environment and card color. The data captured are based on specific parameters this we define as a A UNIQUE MIX OF Image and Signal Processing and AI Technologies
Six stages to extract data
Whilst you are waiting for the frame to turn green, complex processes are happening without you even realising
Light Analysis
Light from surrounding environment reflects to camera. The camera gives us a broadband three-channel sensor we know as RBG, that is, one that scans every wavelength and illuminates a card with different coloured light. This means that, instead of the camera measuring luminous intensity in different colours, the display successively illuminates the object in the environment with a series of different colours for fractions of a second. Thus, if the display casts only red light on the object, the object can only reflect red light – and the camera can only measure red light. Intelligent analysis algorithms enable the app to compensate a smartphone’s limited computing performance as well as the limited performance of the camera and display and create a base line for environmental light. this data is used as an input feature to some models. The camera then performs the camera calibration selecting Regions of interest (this is an auto threshold calibration method, adjusts, biases and focuses at the sensor level. There is a proprietary luminescence correction to improve signal and image sampling.
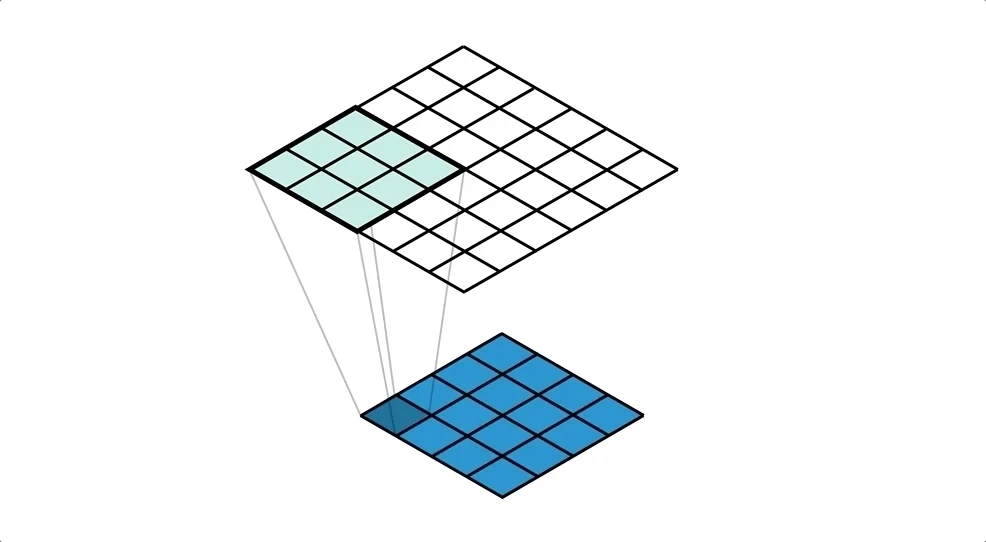
Data is then process through 6 deep ensemble models sequence learning neural network that uses a function that first combines nearby pixels into local features, then aggregates those into global features. Although the algorithm does not explicitly detect image faults, it likely learns to recognise them using the local features.

Then an optimisation algorithm used to train the network weights was a distributed stochastic gradient descent implementation.
However we are able to reveal reveal temporal variations in captured images that are difficult or impossible to see with the naked eye and display them in an indicative manner. Our method, takes a standard 2/3 second video sequence as input, and applies spatial decomposition, followed by temporal filtering to the frames. Every camera is set to a normalised baseline of 30 fps
he resulting signal is then amplified to reveal hidden information. Using this method, we are able to visualize and amplify and reveal small imperfections. Our technique can run in real time to show phenomena occurring at temporal frequencies automatically selected by our algorithms .-amplitude changes that are difficult or impossible to see with the naked eye, such as variation in colour resolution or density can be extracted and amplified to become visible to an observer. This is called Eulerian amplification.

Eulerian methods are better suited to smoother structures such as high quality printed matter, and small amplifications of colour variations typical of highly graded cards.
An Eulerian path is a process which systematically analyses every edge or pixel intensity exactly once to
allow comparison with a reference in the neural network. The colour resolution signal corresponds to
roughly 0.5 intensity units in an 8-bit scale (each pixel records a colour intensity value within 0 −
255). This signal can be reliably extracted using a mobile phone camera or bespoke image scanner to
visualise the spatial distribution of colour quality.
We compare this distribution, pixel-by-pixel, with that of the base image using Eulerian path for the edges as part of the neural network.
We apply the same spatial decomposition using a Gaussian pyramid of 3 − 4 levels, and filter the
signal at the coarse pyramid level temporally selecting frequencies between 0.4−4Hz. The spatial
pooling of the Gaussian pyramid averages over enough pixels reveals the underlying areas of colour
density variation. The Eulerian path analysis allows us to spot edge defects, centring of the image
and scuffs and edge breaks.
This data is then used as inputs into a model which is used to predict a grade :)